

Precision agriculture also known as site specific crop management (SSCM) and satellite farming is an advanced farming technique that utilizes several technologies such as GPS, GIS and remote sensing to collect crucial field related information, which is further analyzed to support grower’s decisions with regard to crop fertilizing, planting, and harvesting. In addition, sensors are placed throughout the field that measure temperature, nutrition level and humidity of the soil. Therefore, the technology eliminates manual human efforts by automating crucial processes including real-time farm monitoring and information sharing.
Precision agriculture is swiftly gaining popularity among farmers due to the increasing need of optimum production with the given resources. Further, the changing weather patterns due to increasing global warming, have necessitated the adoption of advanced technologies to enhance the productivity and crop yield. By offering technologies such as real-time farm monitoring, weather forecasting, optimal field requirements and similar others, precision agriculture enables the farmers to increase the yield with minimum human efforts and wastage. Moreover, the technology enables the farmers to manage their resources as well as access real time information through their smartphones, thereby offering greater mobility and ease of operation. However, major restraints of the market are affordability of the technology and lack of awareness about the benefits of precision agriculture among farmers, particularly in the developing countries.
Segmentation Overview
The report also presents a complete analysis of the world precision agriculture market based on technology, component, and geography. GIS, telematics, VRT, GPS, and remote sensing are some of the key technologies covered in the technology segment. Among these, GPS is the most popular technology. The world precision agriculture market is further bifurcated into two key components: hardware and software. Hardware includes sensors, drones, ASS, radar, GPS, and others (display, satellite, and mobiles). Software includes GIS, crop management software, weather tracking and forecasting software, inventory management software, people management software, and financial management software. The market is further analyzed across four different geographies: North America, Europe, Asia-Pacific, and LAMEA. North America includes the U.S., Mexico, and Canada, whereas Europe covers U.K., Russia, Germany, Italy, France, and rest of Europe. The countries covered under Asia-Pacific are Australia, China, India, Japan, South Korea, Taiwan, and rest of Asia-Pacific. LAMEA is bifurcated into Latin America, the Middle East, and Africa.
World Precision Agriculture Market Segmentation
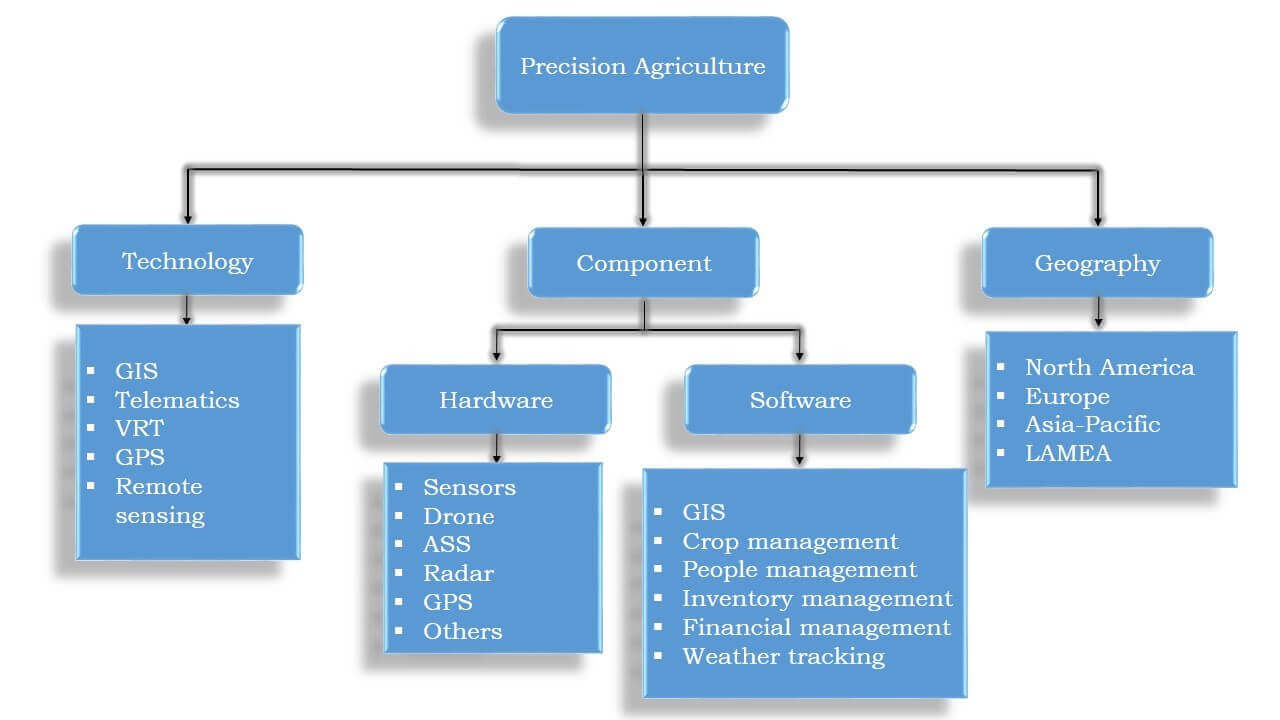
Source: AMR Analysis
Based on various technologies used in precision agriculture, GPS is the highest revenue-generating segment owing to its wide application in agriculture equipment to track location and crops when required. However, GIS is expected to exhibit the highest CAGR to attain significant market value by 2022, owing to the increasing adoption of GIS in agriculture to collect, store, and analyze data for farming.
TOP FACTORS IMPACTING WORLD PRECISION AGRICULTURE MARKET
The top impacting factors of the world precision agriculture market are the growing adoption of smartphones, aggrandized use of cloud technology, booming population, technological advancement, lack of awareness, and high initial investment. Some of the factors such as lack of awareness about precision agriculture products and huge investment act as restraints for the market growth.
Growing Adoption of Smartphones
Smartphone adoption has been one of the most prominent factors in the proliferation of the precision agriculture technology. A smartphone acts as a bridge between the end user and advanced agriculture technology equipment. Integration of smartphones with agriculture equipment and field devices delivers easy access to agriculture mobile applications, which allows farmers to monitor their fields remotely. Therefore, it helps the farmers in keeping pace with the rapidly changing demands of the consumers.
Aggrandized use of cloud technology
Cloud is a centralized, virtualized, automated, and shared infrastructure. Cloud allows storage of crop-related information, which can be further accessed by growers using smartphones. Currently, integrated GPS is available in most of the new agriculture equipment; thus, weather conditions can also be sourced from various cloud-based applications and service providers. Therefore, inclusion of cloud technology in precision agriculture is one of the major drivers for the growth of the world precision agriculture market.
Booming population
The high population growth ratio is the major driving factor of the precision agriculture market, which encourages farmers to implement efficient and advanced agriculture techniques to improve crop yield. In addition, as per the recent survey report, around 80% of the world’s population is projected to live in urban areas by 2050, thereby fostering the demand for housing and food. Hence, farmers are increasingly adopting precision agriculture technique owing to its superior benefits, such as prime output in limited resources and improved crop quality.
World Precision Agriculture Market Top Impacting Factors
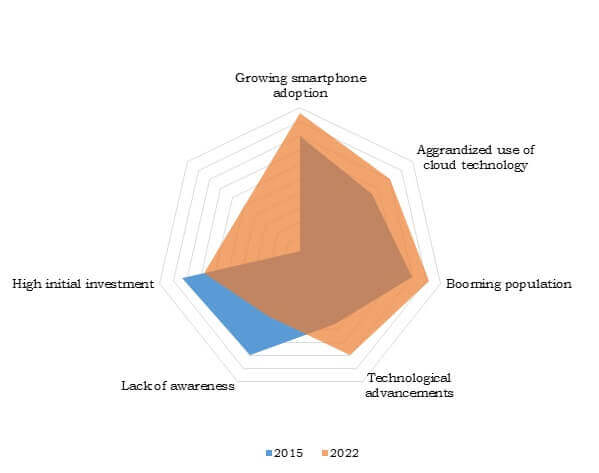
Source: AMR Analysis
The graph below represents the potential of various precision agriculture technologies that are used for monitoring crops. Currently, GPS leads the world precision agriculture market growth, followed by VRT and GIS. GPS market is primarily driven by factors, such as accurate location tracking, minimal fuel consumption, increased productivity, and lower operational costs.
Top investment pockets
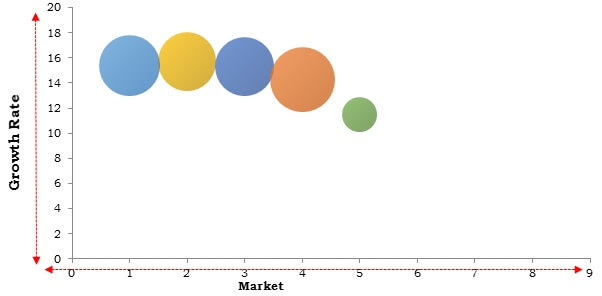
Source: AMR Analysis
The study provides an in-depth analysis of the world precision agriculture market to elucidate the prominent investment pockets in the market.
KEY BENEFITS
PRECISION AGRICULTURE MARKET KEY SEGMENTS:
BY TECHNOLOGY
BY COMPONENT
BY GEOGRAPHY
KEY PLAYERS
CHAPTER 1 INTRODUCTION
1.1 Report description
1.2 Key benefits
1.3 Key market segments
1.4 Research methodology
1.4.1 Secondary research
1.4.2 Primary research
1.4.3 Analyst tools and models
CHAPTER 2 EXECUTIVE SUMMARY
2.1 CXO perspective
CHAPTER 3 MARKET OVERVIEW
3.1 Market definition and scope
3.2 Key findings
3.2.1 Top impacting factors
3.2.2 Top investment pockets
3.2.3 Top winning strategies
3.3 Porter’s five forces analysis
3.3.1 Bargaining power of the supplier
3.3.2 Bargaining power of the buyers
3.3.3 Threat of substitute
3.3.4 Threat of new entrant
3.3.5 Competitive rivalry
3.4 Market share analysis, 2015
3.5 Value chain analysis
3.6 Market dynamics
3.6.1 Drivers
3.6.1.1 Growing adoption of smart phones
3.6.1.2 Aggrandized use of cloud technology
3.6.1.3 Booming population
3.6.2 Restraints
3.6.2.1 Lack of awareness about precision agriculture products
3.6.2.2 Huge investment required for precision agriculture equipment
3.6.3 Opportunity
3.6.3.1 Advancement in technology
CHAPTER 4 WORLD PRECISION AGRICULTURE MARKET, BY TECHNOLOGY
4.1 Geographical information system (GIS)
4.1.1 Key market trends
4.2.2 Key drivers and opportunities
4.3.3 Market size and forecast
4.2 Telematics
4.2.1 Key market trends
4.2.2 Key drivers and opportunities
4.2.3 Market size and forecast
4.3 Variable rate technology (VRT)
4.3.1 Key market trends
4.3.2 Key drivers and opportunities
4.3.3 Market size and forecast
4.4 Global positioning system (GPS)
4.4.1 Key market trends
4.4.2 Key drivers and opportunities
4.4.3 Market size and forecast
4.5 Remote sensing technology
4.5.1 Key market trends
4.5.2 Key drivers and opportunities
4.5.3 Market size and forecast
CHAPTER 5 WORLD PRECISION AGRICULTURE MARKET, BY COMPONENT
5.1 Hardware
5.1.1 Key market trends
5.1.2 Key drivers and opportunities
5.1.3 Market size and forecast
5.1.4 Sensors
5.1.4.1 Market size and forecast
5.1.5 Drone
5.1.5.1 Market size and forecast
5.1.6 Automated steering system (ASS)
5.1.6.1 Market size and forecast
5.1.7 Radar
5.1.7.1 Market size and forecast
5.1.8 GPS
5.1.8.1 Market size and forecast
5.1.9 Others
5.1.9.1 Market size and forecast
5.2 Software
5.2.1 Key market trends
5.2.2 Key growth and opportunities
5.2.3 Market size and forecast
5.2.4 Geographical information system (GIS)
5.2.4.1 Market size and forecast
5.2.5 Crop management software
5.2.5.1 Market size and forecast
5.2.6 People management software
5.2.6.1 Market size and forecast
5.2.7 Inventory management software
5.2.7.1 Market size and forecast
5.2.8 Financial management software
5.2.8.1 Market size and forecast
5.2.9 Weather tracking and forecasting
5.2.9.1 Market size and forecast
CHAPTER 6 WORLD PRECISION AGRICULTURE MARKET, BY GEOGRAPHY
6.1 North America
6.1.1 Key market trends
6.1.2 Key drivers and opportunities
6.1.3 Market size and forecast
6.1.4 U.S.
6.1.5 Mexico
6.1.6 Canada
6.2 Europe
6.2.1 Key market trends
6.2.2 Key drivers and opportunities
6.2.3 Market size and forecast
6.2.4 U.K.
6.2.5 Germany
6.2.6 France
6.2.7 Russia
6.2.8 Rest of Europe
6.3 Asia-Pacific
6.3.1 Key market trends
6.3.2 Key drivers and opportunities
6.3.3 Market size and forecast
6.3.4 India
6.3.5 China
6.3.6 Japan
6.3.7 Australia
6.3.8 Rest of Asia-Pacific
6.4 LAMEA
6.4.1 Key market trends
6.4.2 Key drivers and opportunities
6.4.3 Market size and forecast
6.4.4 Latin America
6.4.5 Middle East
6.4.6 Africa
CHAPTER 7 COMPANY PROFILE
7.1 Deere & Company
7.1.1 Company overview
7.1.2 Company snapshot
7.1.3 Business performance
7.1.4 Strategic moves and developments
7.1.5 SWOT analysis and strategic conclusion of Deere & Company
7.2 CropMetrics LLC
7.2.1 Company overview
7.2.2 Company snapshot
7.2.3 Strategic moves and developments
7.2.4 SWOT analysis and strategic conclusion of CropMetrics LLC.
7.3 Trimble Navigation Limited
7.3.1 Company overview
7.3.2 Company snapshot
7.3.3 Business performance
7.3.4 Strategic moves and developments
7.3.5 SWOT analysis and strategic conclusion of Trimble Navigation Limited
7.4 CropX
7.4.1 Company overview
7.4.2 Company snapshot
7.4.3 Strategic moves and developments
7.4.4 SWOT analysis and strategic conclusion of CropX
7.5 AgSmarts Inc
7.5.1 Company overview
7.5.2 Company snapshot
7.5.3 Strategic moves and developments
7.5.4 SWOT analysis and strategic conclusion of AgSmarts
7.6 AgSense, LLC
7.6.1 Company overview
7.6.2 Strategic moves and developments
7.6.3 SWOT analysis and strategic conclusion of Agsense LLC
7.7 AGCO Corporation
7.7.1 Company overview
7.7.2 Business performance
7.7.3 Strategic moves and developments
7.7.4 SWOT analysis and strategic conclusion of AGCO Corporation
7.8 DICKEY-john
7.8.1 Company overview
7.8.2 Strategic moves and developments
7.8.3 SWOT analysis and strategic conclusion of DICKEY-john
7.9 Monsanto Company
7.9.1 Company overview
7.9.2 Business performance
7.9.3 Strategic moves and developments
7.9.4 SWOT analysis and strategic conclusion of Monsanto Company
7.10 Ag Leader Technology
7.10.1 Company overview
7.10.2 Strategic moves and developments
7.10.3 SWOT analysis and strategic conclusion of Ag Leader Technology
LIST OF FIGURES
FIG. 1 TOP IMPACTING FACTORS
FIG. 2 TOP INVESTMENT POCKETS
FIG. 3 TOP WINNING STRATEGIES IN THE PRECISION AGRICULTURE MARKET (2013-2015)
FIG. 4 TOP WINNING STRATEGIES (PERCENTAGE COMPARISON) (2013-2015)
FIG. 5 PORTER’S FIVE FORCES ANALYSIS
FIG. 6 MARKET SHARE ANALYSIS, 2015
FIG. 7 PRECISION AGRICULTURE MARKET’S VALUE CHAIN
FIG. 8 WORLD PRECISION AGRICULTURE MARKET REVENUE BY TECHNOLOGY, 2015 & 2022 (% SHARE)
FIG. 9 COMPARITIVE REGIONAL MARKET SHARE ANALYSIS OF WORLD GEOGRAPHIC INFORMATION SYSTEM (GIS) MARKET, 2015 & 2022 (%)
FIG. 10 WORLD GEOGRAPHIC INFORMATION SYSTEM (GIS) MARKET REVENUE BY GEOGRAPHY, 2015-2022 ($MILLION)
FIG. 11 WORLD GEOGRAPHIC INFORMATION SYSTEM (GIS) MARKET SHARE ANALYSIS BY GEOGRAPHY, 2015-2022 (%)
FIG. 12 COMPARITIVE REGIONAL MARKET SHARE ANALYSIS OF WORLD TELEMATICS MARKET, 2015 & 2022 (%)
FIG. 13 WORLD TELEMATICS MARKET REVENUE BY GEOGRAPHY, 2015-2022 ($MILLION)
FIG. 14 WORLD TELEMATICS MARKET SHARE ANALYSIS BY GEOGRAPHY, 2015-2022 (%)
FIG. 15 COMPARITIVE REGIONAL MARKET SHARE ANALYSIS OF WORLD VARIABLE RATE TECHNOLOGY (VRT) MARKET, 2015 & 2022 (%)
FIG. 16 WORLD VARIABLE RATE TECHNOLOGY (VRT) MARKET REVENUE BY GEOGRAPHY, 2015- 2022 ($MILLION)
FIG. 17 WORLD VARIABLE RATE TECHNOLOGY (VRT) MARKET SHARE ANALYSIS BY GEOGRAPHY, 2015-2022 (%)
FIG. 18 COMPARITIVE REGIONAL MARKET SHARE ANALYSIS OF WORLD GLOBAL POSITIONING SYSTEM (GPS) MARKET, 2015 & 2022 (%)
FIG. 19 WORLD GLOBAL POSITIONING SYSTEM (GPS) MARKET REVENUE BY GEOGRAPHY, 2015-2022 ($MILLION)
FIG. 20 WORLD GLOBAL POSITIONING SYSTEM (GPS) MARKET SHARE ANALYSIS BY GEOGRAPHY, 2015-2022 (%)
FIG. 21 COMPARITIVE REGIONAL MARKET SHARE ANALYSIS OF WORLD REMOTE SENSING MARKET, 2015 & 2022 (%)
FIG. 22 WORLD REMOTE SENSING MARKET REVENUE BY GEOGRAPHY, 2015-2022 ($MILLION)
FIG. 23 WORLD REMOTE SENSING MARKET SHARE ANALYSIS BY GEOGRAPHY, 2015-2022 (%)
FIG. 24 WORLD PRECISION AGRICULTURE MARKET REVENUE BY COMPONENT, 2015 & 2022 (% SHARE)
FIG. 25 COMPARITIVE REGIONAL MARKET SHARE ANALYSIS OF WORLD HARDWARE MARKET, 2015 & 2022 (%)
FIG. 26 WORLD HARDWARE MARKET REVENUE BY GEOGRAPHY, 2015-2022 ($MILLION)
FIG. 27 WORLD HARDWARE MARKET SHARE ANALYSIS BY GEOGRAPHY, 2015-2022 (%)
FIG. 28 COMPARITIVE REGIONAL MARKET SHARE ANALYSIS OF WORLD SENSORS MARKET, 2015 & 2022 (%)
FIG. 29 WORLD SENSORS MARKET REVENUE BY GEOGRAPHY, 2015-2022 ($MILLION)
FIG. 30 WORLD SENSORS MARKET SHARE ANALYSIS BY GEOGRAPHY, 2015-2022 (%)
FIG. 31 COMPARITIVE REGIONAL MARKET SHARE ANALYSIS OF WORLD DRONE MARKET, 2015 & 2022 (%)
FIG. 32 WORLD DRONE MARKET REVENUE BY GEOGRAPHY, 2015-2022 ($MILLION)
FIG. 33 WORLD DRONE MARKET SHARE ANALYSIS BY GEOGRAPHY, 2015-2022 (%)
FIG. 34 COMPARITIVE REGIONAL MARKET SHARE ANALYSIS OF WORLD AUTOMATED STEERING SYSTEM (ASS) MARKET, 2015 & 2022 (%)
FIG. 35 WORLD AUTOMATED STEERING SYSTEM (ASS) MARKET REVENUE BY GEOGRAPHY, 2015-2022 ($MILLION)
FIG. 36 WORLD AUTOMATED STEERING SYSTEM (ASS) MARKET SHARE ANALYSIS BY GEOGRAPHY, 2015-2022 (%)
FIG. 37 COMPARITIVE REGIONAL MARKET SHARE ANALYSIS OF WORLD RADAR MARKET, 2015 & 2022 (%)
FIG. 38 WORLD RADAR MARKET REVENUE BY GEOGRAPHY, 2015-2022 ($MILLION)
FIG. 39 WORLD RADAR MARKET SHARE ANALYSIS BY GEOGRAPHY, 2015-2022 (%)
FIG. 40 COMPARITIVE REGIONAL MARKET SHARE ANALYSIS OF WORLD GLOBAL POSITIONING SYSTEM (GPS) MARKET, 2015 & 2022 (%)
FIG. 41 WORLD GLOBAL POSITIONING SYSTEM (GPS) MARKET REVENUE BY GEOGRAPHY, 2015-2022 ($MILLION)
FIG. 42 WORLD GLOBAL POSITIONING SYSTEM (GPS) MARKET SHARE ANALYSIS BY GEOGRAPHY, 2015-2022 (%)
FIG. 43 COMPARITIVE REGIONAL MARKET SHARE ANALYSIS OF WORLD OTHERS MARKET, 2015 & 2022 (%)
FIG. 44 WORLD OTHERS MARKET REVENUE BY GEOGRAPHY, 2015-2022 ($MILLION)
FIG. 45 WORLD OTHERS MARKET SHARE ANALYSIS BY GEOGRAPHY, 2015-2022 (%)
FIG. 46 COMPARITIVE REGIONAL MARKET SHARE ANALYSIS OF WORLD SOFTWARE MARKET, 2015 & 2022 (%)
FIG. 47 WORLD SOFTWARE MARKET REVENUE BY GEOGRAPHY, 2015-2022 ($MILLION)
FIG. 48 WORLD SOFTWARE MARKET SHARE ANALYSIS BY GEOGRAPHY, 2015-2022 (%)
FIG. 49 COMPARITIVE REGIONAL MARKET SHARE ANALYSIS OF WORLD GEOGRAPHICAL INFORMATION SYSTEM (GIS) MARKET, 2015 & 2022 (%)
FIG. 50 WORLD GEOGRAPHICAL INFORMATION SYSTEM (GIS) MARKET REVENUE BY GEOGRAPHY, 2015-2022 ($MILLION)
FIG. 51 WORLD GEOGRAPHICAL INFORMATION SYSTEM (GIS) MARKET SHARE ANALYSIS BY GEOGRAPHY, 2015-2022 (%)
FIG. 52 COMPARITIVE REGIONAL MARKET SHARE ANALYSIS OF WORLD CROP MANAGEMENT SOFTWARE MARKET, 2015 & 2022 (%)
FIG. 53 WORLD CROP MANAGEMENT SOFTWARE MARKET REVENUE BY GEOGRAPHY, 2015-2022 ($MILLION)
FIG. 54 WORLD CROP MANAGEMENT SOFTWARE MARKET SHARE ANALYSIS BY GEOGRAPHY, 2015-2022 (%)
FIG. 55 COMPARITIVE REGIONAL MARKET SHARE ANALYSIS OF WORLD PEOPLE MANAGEMENT SOFTWARE MARKET, 2015 & 2022 (%)
FIG. 56 WORLD PEOPLE MANAGEMENT SOFTWARE MARKET REVENUE BY GEOGRAPHY, 2015-2022 ($MILLION)
FIG. 57 WORLD PEOPLE MANAGEMENT SOFTWARE MARKET SHARE ANALYSIS BY GEOGRAPHY, 2015-2022 (%)
FIG. 58 COMPARITIVE REGIONAL MARKET SHARE ANALYSIS OF WORLD INVENTORY MANAGEMENT SOFTWARE MARKET, 2015 & 2022 (%)
FIG. 59 WORLD INVENTORY MANAGEMENT SOFTWARE MARKET REVENUE BY GEOGRAPHY, 2015-2022 ($MILLION)
FIG. 60 WORLD INVENTORY MANAGEMENT SOFTWARE MARKET SHARE ANALYSIS BY GEOGRAPHY, 2015-2022 (%)
FIG. 61 COMPARITIVE REGIONAL MARKET SHARE ANALYSIS OF WORLD FINANCIAL MANAGEMENT SOFTWARE MARKET, 2015 & 2022 (%)
FIG. 62 WORLD FINANCIAL MANAGEMENT SOFTWARE MARKET REVENUE BY GEOGRAPHY, 2015-2022 ($MILLION)
FIG. 63 WORLD FINANCIAL MANAGEMENT SOFTWARE MARKET SHARE ANALYSIS BY GEOGRAPHY, 2015-2022 (%)
FIG. 64 COMPARITIVE REGIONAL MARKET SHARE ANALYSIS OF WORLD WEATHER TRACKING AND FORECASTING SOFTWARE MARKET, 2015 & 2022 (%)
FIG. 65 WORLD WEATHER TRACKING AND FORECASTING SOFTWARE MARKET REVENUE BY GEOGRAPHY, 2015-2022 ($MILLION)
FIG. 66 WORLD WEATHER TRACKING AND FORECASTING SOFTWARE MARKET SHARE ANALYSIS BY GEOGRAPHY, 2015-2022 (%)
FIG. 67 WORLD PRECISION AGRICULTURE MARKET REVENUE BY GEOGRAPHY, 2015 & 2022 (% SHARE)
FIG. 68 NORTH AMERICA PRECISION AGRICULTURE MARKET REVENUE BY COUNTRY, 2015 & 2022 (% SHARE)
FIG. 69 NORTH AMERICA PRECISION AGRICULTURE MARKET REVENUE BY TECHNOLOGY, 2015 & 2022 (% SHARE)
FIG. 70 U.S. PRECISION AGRICULTURE MARKET REVENUE, 2015-2022 ($MILLION)
FIG. 71 MEXICO PRECISION AGRICULTURE MARKET REVENUE, 2015-2022 ($MILLION)
FIG. 72 CANADA PRECISION AGRICULTURE MARKET REVENUE, 2015-2022 ($MILLION)
FIG. 73 EUROPE PRECISION AGRICULTURE MARKET REVENUE BY COUNTRY, 2015 & 2022 (% SHARE)
FIG. 74 EUROPE PRECISION AGRICULTURE MARKET REVENUE BY TECHNOLOGY, 2015 & 2022 (% SHARE)
FIG. 75 U.K PRECISION AGRICULTURE MARKET REVENUE, 2015-2022 ($MILLION)
FIG. 76 GERMANY PRECISION AGRICULTURE MARKET REVENUE, 2015-2022 ($MILLION)
FIG. 77 FRANCE PRECISION AGRICULTURE MARKET REVENUE, 2015-2022 ($MILLION)
FIG. 78 RUSSIA PRECISION AGRICULTURE MARKET REVENUE, 2015-2022 ($MILLION)
FIG. 78 REST OF EUROPE PRECISION AGRICULTURE MARKET REVENUE, 2015-2022 ($MILLION)
FIG. 79 ASIA PACIFIC PRECISION AGRICULTURE MARKET REVENUE BY COUNTRY, 2015 & 2022 (% SHARE)
FIG. 80 ASIA-PACIFIC PRECISION AGRICULTURE MARKET REVENUE BY TECHNOLOGY, 2015 & 2022 (% SHARE)
FIG. 81 INDIA PRECISION AGRICULTURE MARKET REVENUE, 2015-2022 ($MILLION)
FIG. 82 CHINA PRECISION AGRICULTURE MARKET REVENUE, 2015-2022 ($MILLION)
FIG. 83 JAPAN PRECISION AGRICULTURE MARKET REVENUE, 2015-2022 ($MILLION)
FIG. 84 AUSTRALIA PRECISION AGRICULTURE MARKET REVENUE, 2015-2022 ($MILLION)
FIG. 85 REST OF ASIA-PACIFIC PRECISION AGRICULTURE MARKET REVENUE, 2015-2022 ($MILLION)
FIG. 86 LAMEA PRECISION AGRICULTURE MARKET REVENUE BY COUNTRY, 2015 & 2022 (% SHARE)
FIG. 87 LAMEA PRECISION AGRICULTURE MARKET REVENUE BY TECHNOLOGY, 2015 & 2022 (% SHARE)
FIG. 88 LATIN AMERICA PRECISION AGRICULTURE MARKET REVENUE, 2015-2022
FIG. 89 MIDDLE EAST PRECISION AGRICULTURE MARKET REVENUE, 2015-2022)
FIG. 90 AFRICA PRECISION AGRICULTURE MARKET REVENUE, 2015-2022
FIG. 91 DEERE & COMPANY: REVENUE, 2013–2015 ($MILLION)
FIG. 92 DEERE & COMPANY: SWOT ANALYSIS
FIG. 93 CROPMETRICS LLC: SWOT ANALYSIS
FIG. 94 TRIMBLE NAVIGATION LIMITED: REVENUE, 2013–2015 ($MILLION)
FIG. 95 TRIMBLE NAVIGATION LIMITED: REVENUE, BY OPERATING SEGMENT, 2015 (%)
FIG. 96 TRIMBLE NAVIGATION LIMITED: SWOT ANALYSIS
FIG. 97 CROPX: SWOT ANALYSIS
FIG. 98 AGSMARTS INC.: SWOT ANALYSIS
FIG. 99 AGSENSE, LLC: SWOT ANALYSIS
FIG. 100 AGCO CORPORATION: REVENUE, 2013–2015 ($MILLION)
FIG. 101 AGCO CORPORATION: REVENUE, BY GEOGRAPHY, 2015(%)
FIG. 102 AGCO CORPORATION: SWOT ANALYSIS
FIG. 103 DICKEY-JOHN: SWOT ANALYSIS
FIG. 104 MONSANTO COMPANY: REVENUE, 2013–2015 ($MILLION)
FIG. 105 MOSANTO COMPANY: REVENUE, BY OPERATING SEGMENT, 2015(%)
FIG. 106 MOSANTO COMPANY: REVENUE, BY GEOGRAPHY, 2015(%)
FIG. 107 MONSANTO COMPANY: SWOT ANALYSIS
FIG. 108 AG LEADER TECHNOLOGY: SWOT ANALYSIS
LIST OF TABLES
TABLE 1 WORLD PRECISION AGRICULTURE MARKET REVENUE, 2015–2022 ($MILLION)
TABLE 2 WORLD PRECISION AGRICULTURE MARKET REVENUE BY TECHNOLOGY, 2015-2022 ($MILLION)
TABLE 3 WORLD GIS MARKET REVENUE BY GEOGRAPHY, 2015-2022 ($MILLION)
TABLE 4 WORLD TELEMATICS MARKET REVENUE BY GEOGRAPHY, 2015-2022 ($MILLION)
TABLE 5 WORLD VRT MARKET REVENUE BY GEOGRAPHY, 2015-2022 ($MILLION)
TABLE 6 WORLD GPS MARKET REVENUE BY GEOGRAPHY, 2015-2022 ($MILLION)
TABLE 7 WORLD REMOTE SENSING MARKET REVENUE BY GEOGRAPHY, 2015-2022 ($MILLION)
TABLE 8 WORLD PRECISION AGRICULTURE MARKET REVENUE BY COMPONENT, 2015-2022 ($MILLION)
TABLE 9 WORLD PRECISION AGRICULTURE HARDWARE MARKET REVENUE BY GEOGRAPHY, 2015-2022 ($MILLION)
TABLE 10 WORLD PRECISION AGRICULTURE MARKET REVENUE BY HARDWARE, 2015-2022 ($MILLION)
TABLE 11 WORLD SENSORS MARKET REVENUE BY GEOGRAPHY, 2015-2022 ($MILLION)
TABLE 12 WORLD DRONE MARKET BY REVENUE GEOGRAPHY, 2015-2022 ($MILLION)
TABLE 13 WORLD AUTOMATED STEERING SYSTEM (ASS) MARKET REVENUE BY GEOGRAPHY, 2015-2022 ($MILLION)
TABLE 14 WORLD RADAR MARKET REVENUE BY GEOGRAPHY, 2015-2022 ($MILLION)
TABLE 15 WORLD GPS MARKET REVENUE BY GEOGRAPHY, 2015-2022 ($MILLION)
TABLE 16 WORLD OTHERS MARKET, BY GEOGRAPHY, 2015-2022 ($MILLION)
TABLE 17 WORLD PRECISION AGRICULTURE SOFTWARE MARKET REVENUE BY GEOGRAPHY, 2015-2022 ($MILLION)
TABLE 18 WORLD PRECISION AGRICULTURE MARKET REVENUE BY SOFTWARE, 2015-2022 ($MILLION)
TABLE 19 WORLD PRECISION AGRICULTURE GIS SOFTWARE MARKET REVENUE BY GEOGRAPHY, 2015-2022 ($MILLION)
TABLE 20 WORLD PRECISION AGRICULTURE CROP MANAGEMENT SOFTWARE MARKET REVENUE BY GEOGRAPHY, 2015-2022 ($MILLION)
TABLE 21 WORLD PRECISION AGRICULTURE PEOPLE MANAGEMENT SOFTWARE MARKET REVENUE BY GEOGRAPHY, 2015-2022 ($MILLION)
TABLE 22 WORLD PRECISION AGRICULTURE INVENTORY MANAGEMENT SOFTWARE MARKET REVENUE BY GEOGRAPHY, 2015-2022 ($MILLION)
TABLE 23 WORLD PRECISION AGRICULTURE FINANCIAL MANAGEMENT SOFTWARE MARKET REVENUE BY GEOGRAPHY, 2015-2022 ($MILLION)
TABLE 24 WORLD PRECISION AGRICULTURE WEATHER TRACKING AND FORECASTING MARKET REVENUE BY GEOGRAPHY, 2015-2022 ($MILLION)
TABLE 25 NORTH AMERICA PRECISION AGRICULTURE MARKET BY TECHNOLOGY, 2015-2022 ($MILLION)
TABLE 26 EUROPE PRECISION AGRICULTURE MARKET BY TECHNOLOGY, 2015-2022 ($MILLION)
TABLE 27 ASIA-PACIFIC PRECISION AGRICULTURE MARKET BY TECHNOLOGY, 2015-2022 ($MILLION)
TABLE 28 LAMEA PRECISION AGRICULTURE MARKET REVENUE BY TECHNOLOGY, 2015-2022 ($MILLION)
TABLE 29 DEERE & COMPANY: SNAPSHOT
TABLE 30 CROPMETRICS LLC: SNAPSHOT
TABLE 31 TRIMBLE NAVIGATION LIMITED: SNAPSHOT
TABLE 32 CROPX: SNAPSHOT
TABLE 33 AGSMARTS: SNAPSHOT
TABLE 34 AGSENSE, LLC: SNAPSHOT
TABLE 35 AGCO CORPORATION: SNAPSHOT
TABLE 36 DICKEY-JOHN: SNAPSHOT
TABLE 37 MONSANTO COMPANY: SNAPSHOT
TABLE 38 AG LEADER TECHNOLOGY: SNAPSHOT
Contact us at the Consulting WP office nearest to you or submit a business inquiry online.
Subscribe to Our Newsletter
Published On : December 2019
$ 3600
Published On : November 2019
$ 3600
Published On : November 2019
$ 3600
Published On : November 2019
$ 3600
$ 3950
