

Liver disease comprises of wide range of complex conditions affecting the liver. Liver disease treatment market is assured to grow on account of unmet clinical needs and upcoming treatment modifications. Number of novel agents has shown improvements in clinical trials such as obeticholic acid, thiazolidinediones and vitamin E for treatment of nonalcoholic fatty liver diseases. Additionally, according to American Cancer Society liver cancer rates increases 2.7% every year propelling the growth of market.
Changing lifestyle such as increasing consumption of alcohol, unhealthy diets have increased the incidences of liver disease. Whereas, growing geriatric population has lead to significant addition in the world liver disease treatment market. There is huge market potential for this market as the occurrences of disorders have become common. Government and non government awareness programs would help the growth of liver disease treatment Industry.
However, stringent government regulations (FDA, MHRA), high cost incurred in drug research and development pose a crucial challenge for liver disease treatment Industry. Side effect associated with medication is the growing concern expected for declining of market value. Patent expiry and growing health awareness in public would encourage the growth of the market. New research and development will provide immense opportunity for market players. For instance, Yaqrit Limited has developed a new product, Yaq-001 which will be introduced in 3 years for treatment of chronic liver diseases.
The liver disease treatment market is segmented into treatment type and geography. By treatment type the market is bifurcated into Chemotherapy drugs, targeted therapy, anti-viral drugs, immunoglobulins, corticosteroids, vaccines, anti-rejection drugs/immunosuppressant. By geography segmented into North America, Europe, APAC and LAMEA. North America is bifurcated into the U.S., Mexico and Canada whereas Europe have been further segmented into UK, Russia, Germany, Italy, France and rest of Europe. APAC comprises of China, India, Japan, South Korea, Taiwan and rest of Asia Pacific. LAMEA includes Latin America, Middle East and Africa.
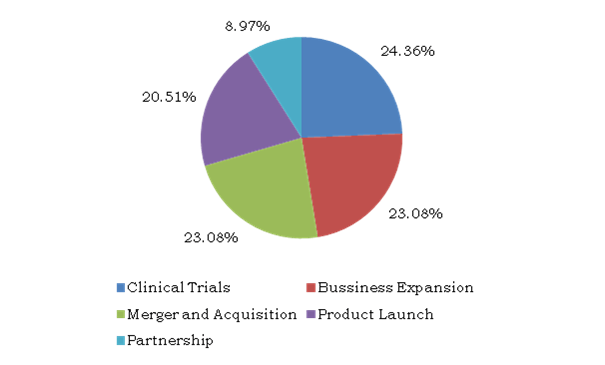
TOP WINNING STRATEGIES
WHO estimated increase in liver disease due to rising alcohol drinking in Europe whereas; more than 1000 people die of liver cancer due to aflatoxin in western pacific region. The major companies covered under the scope of the study are Gilead Science Inc., Bayer AG, AstraZeneca, GlaxoSmithKline plc, Merck & Co. Inc, Sanofi, Pfizer Inc., F. Hoffmann-La Roche AG, Novartis AG, and Johnson &Johnson Private Limited among others
Changing lifestyle patterns such as increasing consumption of alcohol, unhealthy diets
Unhealthy diet, high stress levels and unorganized lifestyle patterns are the major driving forces of liver disease treatment market. Numbers of overweight and obesity in developed countries have quadrupled since 1980 thereby, escalating the risk of liver diseases. In addition, growing alcohol consumption has fueled rise in fatal liver disease. These drivers have increased incidences of liver diseases which would propel the growth of liver disease treatment market in future.
Increasing incidences of liver diseases
Increasing incidences of obesity, metabolic syndrome, diabetes and cardiovascular disorders that lead to liver diseases are another major factor boosting the growth of liver disease treatment market. Additionally, increasing prevalence of liver disease due to side effects of other drugs such as acetaminophen and poor hygienic and sanitation conditions are expected to drive the market in the coming years.
Growing geriatric population
Structural dysfunction or alteration due to aging mainly leads to liver diseases. According to the National Institute of Aging, geriatric population is likely to increase by 86% till 2050. The increasing rates of geriatric population have resulted in rise of the incidences of liver diseases, which further escalating the demand of liver disease treatment market.
Government and non government awareness program /Liver organizations
With increasing prevalence of liver diseases, increasing awareness has become a necessity. Government and not-for-profit organizations are playing a crucial role in the rising awareness about the liver diseases around the world. These organizations promote the awareness of the liver related diseases and support for research and development for the prevention, treatment and cure of liver diseases.
Increasing R&D to develop innovative products
Several companies are investing in their R&D to develop innovative and advanced treatment for liver disease. Research and development of high efficient and less or no side effects pharmaceutical drugs would drive the market in the near future.
Availability of generic and bio-similar drugs
Patent expiry in upcoming years of various block-buster liver disease treatment drugs have created new gateway for the entrance of generic market. Moreover, due to the low cost of generic drugs compared to the branded therapies, there is more preference towards generic drugs or bio similar drugs for the treatment of various diseases.
KEY BENEFITS FOR SHAREHOLDERS
KEY MARKET SEGMENTS:
CHAPTER 1 INTRODUCTION
1.1 Report description
1.2 Key benefits
1.3 Key market segments
1.4 Research methodology
1.4.1 Secondary research
1.4.2 Primary research
1.4.3 Analyst tools and models
CHAPTER 2 EXECUTIVE SUMMARY
2.1 CXO perspective
CHAPTER 3 MARKET OVERVIEW
3.1 Market definition and scope
3.2 Key Findings
3.2.1 Top impacting factor
3.2.2 Top winning strategies
3.3.3 Top investment pockets
3.3 Porters five forces analysis
3.3.1 Low bargaining power of suppliers due to large number of suppliers and low switching cost
3.3.2 Moderate bargaining power of buyer due to large number of buyer, high product dependency and less switching cost.
3.3.3 Low threat of substitutes due to low preference of substitutes and high brand loyalty
3.3.4 Low threat of new entrants due to presence of dominant players and strict government regulations
3.3.5 Presence of numerous players, high exist barriers, high economic base increases the competition among rivalries
3.4 Market share analysis, 2015
3.5 Drivers
3.5.1 Rapidly changing lifestyle patterns such as increasing consumption of alcohol, and unhealthy diets
3.5.2 Increasing prevalence of liver diseases
3.5.3 Growing geriatric population
3.5.4 Increasing government and non-government awareness programs
3.5.5 Increasing R&D investments for the development of novel therapies
3.6 Restraint
3.6.1 Stringent government regulations
3.6.2 High cost incurred in drug R&D
3.6.3 Side effect associated with medication
3.7 Opportunities
3.7.1 Availability of generic and bio-similar drugs
CHAPTER 4 WORLD LIVER DISEASE TREATMENT MARKET, BY TREATMENT TYPE
4.1 Introduction
4.2 Anti Viral Drugs
4.2.1 KEY MARKET TRENDS
4.2.2 KEY GROWTH FACTORS AND OPPORTUNITIES
4.2.3 MARKET SIZE AND FORECAST
4.2.4 NORTH AMERICA ANTIVIRAL DRUGS MARKET, ($MILLION), GROWTH (%) 2014-2022
4.2.5 EUROPE ANTIVIRAL DRUGS MARKET, ($MILLION), GROWTH (%) 2014-2022
4.2.6 ASIA PACIFIC ANTIVIRAL DRUGS MARKET, ($MILLION), GROWTH (%) 2014-202
4.2.7 LAMEA ANTIVIRAL DRUGS MARKET, ($MILLION), GROWTH (%) 2014-2022
4.3 Vaccines
4.3.1 KEY MARKET TRENDS
4.3.2 KEY GROWTH FACTORS AND OPPORTUNITIES
4.3.3 MARKET SIZE AND FORECAST
4.3.4 NORTH AMERICA VACCINES MARKET, ($MILLION), GROWTH (%) 2014-2022
4.3.5 EUROPE VACCINES MARKET, ($MILLION), GROWTH (%) 2014-2022
4.3.6 ASIA PACIFIC VACCINES MARKET, ($MILLION), GROWTH (%) 2014-2022
4.3.7 LAMEA VACCINES MARKET, ($MILLION), GROWTH (%) 2014-2022
4.4 Anti Rejection Drugs/ Immunosuppressant Drugs
4.4.1 KEY MARKET TRENDS
4.4.2 KEY GROWTH FACTORS AND OPPORTUNITIES
4.4.3 MARKET SIZE AND FORECAST
4.4.4 NORTH AMERICA ANTI REJECTION DRUGS / IMMUNOSUPPRESANT DRUGS MARKET, ($MILLION), GROWTH (%) 2014-2022
4.4.5 EUROPE ANTI REJECTION DRUGS / IMMUNOSUPPRESANT DRUGS MARKET, ($MILLION), GROWTH (%) 2014-2022
4.4.6 ASIA PACIFIC ANTI REJECTION DRUGS / IMMUNOSUPPRESANT DRUGS MARKET, ($MILLION), GROWTH (%) 2014-2022
4.4.7 LAMEA ANTI REJECTION DRUGS / IMMUNOSUPPRESANT DRUGS MARKET, ($MILLION), GROWTH (%) 2014-2022
4.5 Chemotherapy Drugs
4.5.1 KEY MARKET TRENDS
4.5.2 KEY GROWTH FACTORS AND OPPORTUNITIES
4.5.3 MARKET SIZE AND FORECAST
4.5.4 NORTH AMERICA CHEMOTHERAPY DRUGS MARKET, ($MILLION), GROWTH (%) 2014-2022
4.5.5 EUROPE CHEMOTHERAPY DRUGS MARKET, ($MILLION), GROWTH (%) 2014-2022
4.5.6 ASIA PACIFIC CHEMOTHERAPY DRUGS MARKET, ($MILLION), GROWTH (%) 2014-2022
4.5.7 LAMEA CHEMOTHERAPY DRUGS MARKET, ($MILLION), GROWTH (%) 2014-2022
4.6 Targeted Therapy
4.6.1 KEY MARKET TRENDS
4.6.2 KEY GROWTH FACTORS AND OPPORTUNITIES
4.6.3 MARKET SIZE AND FORECAST
4.6.4 NORTH AMERICA TARGETED THERAPY MARKET, ($MILLION), GROWTH (%) 2014-2022
4.6.5 EUROPE TARGETED THERAPY MARKET, ($MILLION), GROWTH (%) 2014-2022
4.6.6 ASIA PACIFIC TARGETED THERAPY MARKET, ($MILLION), GROWTH (%) 2014-2022
4.6.7 LAMEA TARGETED THERAPY MARKET, ($MILLION), GROWTH (%) 2014-2022
4.7 Immunoglobulin
4.7.1 KEY MARKET TRENDS
4.7.2 KEY GROWTH FACTORS AND OPPORTUNITIES
4.7.3 MARKET SIZE AND FORECAST
4.7.4 NORTH AMERICA IMMUNOGLOBULIN MARKET, ($MILLION), GROWTH (%) 2014-2022
4.7.5 EUROPE IMMUNOGLOBULIN MARKET, ($MILLION), GROWTH (%) 2014-2022
4.7.6 ASIA PACIFIC IMMUNOGLOBULIN MARKET, ($MILLION), GROWTH (%) 2014-2022
4.7.7 LAMEA IMMUNOGLOBULIN MARKET, ($MILLION), GROWTH (%) 2014-2022
4.8 Corticosteroids
4.8.1 KEY MARKET TRENDS
4.8.2 KEY GROWTH FACTORS AND OPPORTUNITIES
4.8.3 MARKET SIZE AND FORECAST
4.8.4 NORTH AMERICA CORTICOSTEROIDS MARKET, ($MILLION), GROWTH (%) 2014-2022
4.8.5 EUROPE CORTICOSTEROIDS MARKET, ($MILLION), GROWTH (%) 2014-2022
4.8.6 ASIA PACIFIC CORTICOSTEROIDS MARKET, ($MILLION), GROWTH (%) 2014-2022
4.8.7 LAMEA CORTICOSTEROIDS MARKET, ($MILLION), GROWTH (%) 2014-2022
CHAPTER 5 WORLD LIVER DISEASE TREATMENT MARKET, BY GEOGRAPHY
5.1 Introduction
5.2 North America
5.2.1 KEY MARKET TRENDS
5.2.2 KEY GROWTH FACTORS AND OPPORTUNITIES
5.2.3 MARKET SIZE AND FORECAST
5.2.4 U.S. LIVER DISEASE TREATMENT MARKET, ($MILLION), GROWTH (%) 2014-2022
5.2.5 MEXICO LIVER DISEASE TREATMENT MARKET, ($MILLION), GROWTH (%) 2014-2022
5.2.6 CANADA LIVER DISEASE TREATMENT MARKET, ($MILLION), GROWTH (%) 2014-2022
5.3 Europe
5.3.1 KEY MARKET TRENDS
5.3.2 KEY GROWTH FACTORS AND OPPORTUNITIES
5.3.3 MARKET SIZE AND FORECAST
5.3.4 GERMANY LIVER DISEASE TREATMENT MARKET, ($MILLION), GROWTH (%) 2014-2022
5.3.5 UK LIVER DISEASE TREATMENT MARKET, ($MILLION), GROWTH (%) 2014-2022
5.3.6 ITALY LIVER DISEASE TREATMENT MARKET, ($MILLION), GROWTH (%) 2014-2022
5.3.7 FRANCE LIVER DISEASE TREATMENT MARKET, ($MILLION), GROWTH (%) 2014-2022
5.3.8 REST OF EUROPE LIVER DISEASE TREATMENT MARKET, ($MILLION), GROWTH (%) 2014-2022
5.4 Asia Pacific (APAC)
5.4.1 KEY MARKET TRENDS
5.4.2 KEY GROWTH FACTORS AND OPPORTUNITIES
5.4.3 MARKET SIZE AND FORECAST
5.4.4 JAPAN LIVER DISEASE TREATMENT MARKET, ($MILLION), GROWTH (%) 2014-2022
5.4.5 CHINA LIVER DISEASE TREATMENT MARKET, ($MILLION), GROWTH (%) 2014-2022
5.4.6 INDIA LIVER DISEASE TREATMENT MARKET, ($MILLION), GROWTH (%) 2014-2022
5.4.7 REST OF APAC LIVER DISEASE TREATMENT MARKET, ($MILLION), GROWTH (%) 2014-2022
5.5 LAMEA
5.5.1 KEY MARKET TRENDS
5.5.2 KEY GROWTH FACTORS AND OPPORTUNITIES
5.5.3 MARKET SIZE AND FORECAST
5.5.4 LATIN AMERIC LIVER DISEASE TREATMENT MARKET, ($MILLION), GROWTH (%) 2014-2022
5.5.5 MIDDLE EAST LIVER DISEASE TREATMENT MARKET, ($MILLION), GROWTH (%) 2014-2022
5.5.6 AFRICA LIVER DISEASE TREATMENT MARKET, ($MILLION), GROWTH (%) 2014-2022
List of Figures
FIG. 1 TOP IMPACTING FACTORS
FIG. 2 TOP WINNING STRATEGIES IN THE LIVER DISEASE TREATMENT MARKET (20132016)
FIG. 3 TOP WINNING STRATEGIES (%) (20132016)
FIG. 4 TOP INVESTMENT POCKETS
FIG. 5 PORTERS FIVE FORCES ANALYSIS OF LIVER DISEASE TREATMENT MARKET
FIG. 6 MARKET SHARE ANALYSIS OF LIVER DISEASE TREATMENT MARKET, BY ANTIVIRAL DRUGS MARKET, 2015
FIG. 7 MARKET SHARE ANALYSIS OF LIVER DISEASE TREATMENT MARKET, BY ANTIREJECTION DRUGS / IMMUNOSUPPRESSANT DRUGS MARKET, 2015
FIG. 8 WORLD AGEING POPULATION EXPECTED GROWTH RATE, 2000, 2025 AND 2050
FIG. 9 DEVELOPMENT AND REGULATORY TIME PROFILE FOR NEW DRUG
FIG. 10 CLINICAL PHASE TRASITION PROBABILITY AND OVERALL CLINICAL APPROVAL SUCCESS RATE
FIG. 11 WORLD LIVER DISEASE TREATMENT MARKET BY TREATMENT TYPE, 2015 (PIE CHART OF GLOBAL NUMBERS BY TREATMENT TYPE)
FIG. 12 WORLD ANTIVIRAL DRUGS MARKET, YEAR ON YEAR GROWTH(%), 2015-2022
FIG. 13 WORLD VACCINES MARKET, YEAR ON YEAR GROWTH(%), 2015-2022
FIG. 14 WORLD ANTI REJECTION DRUGS / IMMUNOSUPPRESANT DRUGS, YEAR ON YEAR GROWTH(%), 2015-2022
FIG. 15 WORLD LIVER DISEASE TREATMENT MARKET, BY CHEMOTHERAPY DRUGS, YEAR ON YEAR GROWTH(%), 2015-2022
FIG. 16 WORLD TARGETED THERAPY MARKET, YEAR ON YEAR GROWTH(%), 2015-2022
FIG. 17 WORLD IMMUNOGLOBULIN MARKET , YEAR ON YEAR GROWTH(%), 2015-2022
FIG. 18 WORLD LIVER DISEASE TREATMENT MARKET, BY CORTICOSTEROIDS , YEAR ON YEAR GROWTH(%), 2015-2022
FIG. 19 WORLD LIVER DISEASE TREATMENT MARKET BY GEOGRAPHY, 2015(PIE CHART OF GLOBAL NUMBERS BY GEOGRAPHY)
FIG. 20 WORLD NORTH AMERICA MARKET, YEAR ON YEAR GROWTH(%), 2015-2022
FIG. 21 WORLD EUROPE MARKET, YEAR ON YEAR GROWTH(%), 2015-2022
FIG. 22 WORLD LIVER DISEASE TREATMENT MARKET, BY ASIA PACIFIC, YEAR ON YEAR GROWTH(%), 2015-2022
FIG. 23 WORLD LAMEA MARKET, YEAR ON YEAR GROWTH(%), 2015-2022
List of Tables
TABLE 1 MAJOR REGULATORY AUTHORITY WORLD WIDE
TABLE 2 CLINICAL TRAILS ONGOING ON DIFFERENT LIVER DISEASES
TABLE 3 WORLD ANTIVIRAL DRUGS MARKET, ($MILLION), GROWTH (%)2014-2022
TABLE 4 NORTH AMERICA ANTIVIRAL DRUGS MARKET, ($MILLION), GROWTH (%) 2014-2022
TABLE 5 EUROPE ANTIVIRAL DRUGS MARKET, ($MILLION), GROWTH (%) 2014-2022
TABLE 6 ASIA PACIFIC ANTIVIRAL DRUGS MARKET, ($MILLION), GROWTH (%) 2014-2022
TABLE 7 LAMEA ANTIVIRAL DRUGS MARKET, ($MILLION), GROWTH (%) 2014-2022
TABLE 8 WORLD VACCINES MARKET, ($MILLION), GROWTH (%)2014-2022
TABLE 9 NORTH AMERICA VACCINES MARKET, ($MILLION), GROWTH (%) 2014-2022
TABLE 10 EUROPE VACCINES MARKET, ($MILLION), GROWTH (%) 2014-2022
TABLE 11 ASIA PACIFIC VACCINES MARKET, ($MILLION), GROWTH (%) 2014-2022
TABLE 12 LAMEA VACCINES MARKET, ($MILLION), GROWTH (%) 2014-2022
TABLE 13 WORLD ANTI REJECTION DRUGS / IMMUNOSUPPRESANT DRUGS MARKET, ($MILLION), GROWTH (%)2014-2022
TABLE 14 NORTH AMERICA ANTI REJECTION DRUGS / IMMUNOSUPPRESANT
TABLE 15 EUROPE ANTI REJECTION DRUGS / IMMUNOSUPPRESANT DRUGS MARKET, ($MILLION), GROWTH (%) 2014-2022
TABLE 16 ASIA PACIFIC ANTI REJECTION DRUGS / IMMUNOSUPPRESANT DRUGS MARKET, ($MILLION), GROWTH (%) 2014-2022
TABLE 17 LAMEA ANTI REJECTION DRUGS / IMMUNOSUPPRESANT DRUGS MARKET, ($MILLION), GROWTH (%) 2014-2022
TABLE 18 WORLD CHEMOTHERAPY DRUGS MARKET, ($MILLION), GROWTH (%)2014-2022
TABLE 19 NORTH AMERICA CHEMOTHERAPY DRUGS MARKET, ($MILLION), GROWTH (%) 2014-2022
TABLE 20 EUROPE CHEMOTHERAPY DRUGS MARKET, ($MILLION), GROWTH (%) 2014-2022
TABLE 21 ASIA PACIFIC CHEMOTHERAPY DRUGS MARKET, ($MILLION), GROWTH (%) 2014-2022
TABLE 22 LAMEA CHEMOTHERAPY DRUGS MARKET, ($MILLION), GROWTH (%) 2014-2022
TABLE 23 WORLD TARGETED THERAPY MARKET, ($MILLION), GROWTH (%)2014-2022
TABLE 24 NORTH AMERICA TARGETED THERAPY MARKET, ($MILLION), GROWTH (%) 2014-2022
TABLE 25 EUROPE TARGETED THERAPY MARKET, ($MILLION), GROWTH (%) 2014-2022
TABLE 26 ASIA PACIFIC TARGETED THERAPY MARKET, ($MILLION), GROWTH (%) 2014-2022
TABLE 27 LAMEA TARGETED THERAPY MARKET, ($MILLION), GROWTH (%) 2014-2022
TABLE 28 WORLD IMMUNOGLOBULIN MARKET, ($MILLION), GROWTH (%)2014-2022
TABLE 29 NORTH AMERICA IMMUNOGLOBULIN MARKET, ($MILLION), GROWTH (%) 2014-2022
TABLE 30 EUROPE IMMUNOGLOBULIN MARKET, ($MILLION), GROWTH (%) 2014-2022
TABLE 31 ASIA PACIFIC IMMUNOGLOBULIN MARKET, ($MILLION), GROWTH (%) 2014-2022
TABLE 32 LAMEA IMMUNOGLOBULIN MARKET, ($MILLION), GROWTH (%) 2014-2022
TABLE 33 WORLD CORTICOSTEROIDS MARKET, ($MILLION), GROWTH (%)2014-2022
TABLE 34 NORTH AMERICA CORTICOSTEROIDS MARKET, ($MILLION), GROWTH (%) 2014-2022
TABLE 35 EUROPE CORTICOSTEROIDS MARKET, ($MILLION), GROWTH (%) 2014-2022
TABLE 36 ASIA PACIFIC CORTICOSTEROIDS MARKET, ($MILLION), GROWTH (%) 2014-2022
TABLE 37 LAMEA CORTOCOSTEROIDS MARKET, ($MILLION), GROWTH (%) 2014-2022
TABLE 38 NORTH AMERICA MARKET, ($MILLION), GROWTH (%)2014-2022
TABLE 39 U.S. LIVER DISEASE TREATMENT MARKET, ($MILLION), GROWTH (%) 2014-2022
TABLE 40 MEXICO LIVER DISEASE TREATMENT MARKET, ($MILLION), GROWTH (%) 2014-2022
TABLE 41 CANADA LIVER DISEASE TREATMENT MARKET, ($MILLION), GROWTH (%) 2014-2022
TABLE 42 WORLD EUROPE MARKET, ($MILLION), GROWTH (%)2014-2022
TABLE 43 GERMANY LIVER DISEASE TREATMENT MARKET, ($MILLION), GROWTH (%) 2014-2022
TABLE 44 UK LIVER DISEASE TREATMENT, ($MILLION), GROWTH (%) 2014-2022
TABLE 45 ITALY LIVER DISEASE TREATMENT MARKET, ($MILLION), GROWTH (%) 2014-2022
TABLE 46 FRANCE LIVER DISEASE TREATMENT MARKET, ($MILLION), GROWTH (%) 2014-2022
TABLE 47 REST OF EUROPE LIVER DISEASE TREATMENT MARKET, ($MILLION), GROWTH (%) 2014-2022
TABLE 48 ASIA PACIFIC MARKET, ($MILLION), GROWTH (%)2014-2022
TABLE 49 JAPAN LIVER DISEASE TREATMENT MARKET, ($MILLION), GROWTH (%) 2014-2022
TABLE 50 CHINA LIVER DISEASE TREATMENT MARKET, ($MILLION), GROWTH (%) 2014-2022
TABLE 51 INDIA LIVER DISEASE TREATMENT MARKET, ($MILLION), GROWTH (%) 2014-2022
TABLE 52 REST OF APAC LIVER DISEASE TREATMENT MARKET, ($MILLION), GROWTH (%) 2014-2022
TABLE 53 LAMEA MARKET, ($MILLION), GROWTH (%)2014-2022
TABLE 54 LATIN AMERICA LIVER DISEASE TREATMENT MARKET, ($MILLION), GROWTH (%) 2014-2022
TABLE 55 MIDDLE EAST LIVER DISEASE TREATMENT MARKET, ($MILLION), GROWTH (%) 2014-2022
TABLE 56 AFRICA LIVER DISEASE TREATMENT MARKET, ($MILLION), GROWTH (%) 2014-2022
Contact us at the Consulting WP office nearest to you or submit a business inquiry online.
Subscribe to Our Newsletter
Published On : December 2019
$ 3600
Published On : November 2019
$ 3600
Published On : October 2019
$ 2950
Published On : October 2019
$ 2950
Published On : October 2019
$ 2950
